Monday, 25 November 2013

UML IMP QUESTIONS

1.WHAT IS DESIGN PATTERNS & ESSENTIAL ELEMENTS?
HOW DO WE DESCRIBE DESIGN PATTERNS?
ABSTRACT FACTORY?
SINGLETON?
ADAPTER?
FACADE?
CHAIN OF RESPONSIBILITIES?
OBSERVED?

Monday, 11 November 2013

UML LAB PROGRAMS

Interaction Diagrams


Interaction Diagrams:
   Terms and Concepts:
              An interaction is a behavior that comprises a set of messages exchanged among a set of Objects within a context to accomplish a purpose.
              A message is a specification of a communication between objects that conveys information with the expectation that activity will ensue.
              A sequence diagram is an interaction diagram that emphasizes the time ordering of messages.
              A collaboration diagram is an interaction diagram that emphasizes the structural organization of the objects that send and receive messages.
    
 Interaction diagrams commonly contain
·                     Objects
·                     Links
·                     Messages
 Interaction diagrams are used in two ways:
·                     Modeling a Flow of Control
·                     Modeling Flows of Control by Time Ordering
 To model a flow of control,
·                     Set the context for the interaction, whether it is the system as a whole, a class, or an individual operation.
·                     Set the stage for the interaction by identifying which objects play a role; set their initial properties, including their attribute values, state, and role.
·                     If your model emphasizes the structural organization of these objects, identify the links that connect them, relevant to the paths of communication that take place in this interaction. Specify the nature of the links using the UML's standard stereotypes and constraints, as necessary.
·                     In time order, specify the messages that pass from object to object. As necessary, distinguish the different kinds of messages; include parameters and return values to convey the necessary detail of this interaction.
Also to convey the necessary detail of this interaction, adorn each object at every moment in time with its state and role.

Class Diagrams


Class Diagrams:
Terms and Concepts:
                      A class is a description of a set of objects that share the same attributes, operations, relationships and semantics. Graphically, a class is rendered as a rectangle.
Class diagram commonly contains the following things.
·                     Classes,
·                     Interfaces,
·                     Collaboration,
·                     Dependency, Generalization and Association, Relationships.
Class diagrams may also contain packages or subsystems both of which are used to group elements of your model into layer chunks.

Class diagrams are used in one of 3 ways.
·                     Modeling the Vocabulary of a System.
·                     Modeling the Distribution of Responsibilities in a System.
·                     Modeling Non-software Things.

Common Modeling Techniques
            You'll use classes most commonly to model abstractions that are drawn from the problem, you are trying to solve or from the technology you are using to implement a solution to that problem. Each of these abstractions is a part of the vocabulary of your system, meaning that, together, they represent the things that are important to users and to implementers.

Modeling Non-software Things
    To model the vocabulary of a system,
·                     Identify those things that users or implementers use to describe the problem or solution.
·                     Use CRC cards and use case-based analysis to help find these abstractions.
·                     For each abstraction, identify a set of responsibilities. Make sure that each class is crisply defined and that there is a good balance of responsibilities among all your classes.
·                     Provide the attributes and operations that are needed to carry out these responsibilities for each class.
Modeling the Distribution of Responsibilities in a System
      To model the distribution of responsibilities in a system,
·                     Identify a set of classes that work together closely to carry out some behavior.
·                     Identify a set of responsibilities for each of these classes.Look at this set of classes as a whole, split classes that have too many responsibilities into smaller abstractions, collapse tiny classes that have trivial responsibilities into larger ones, and reallocate responsibilities so that each abstraction reasonably stands on its own.
·                     Consider the ways in which those classes collaborate with one another, and redistribute their responsibilities accordingly so that no class within a collaboration does too much or too little.

Modeling Non-software Things
       To model non-software things,
·                     Model the thing you are abstracting as a class.
·                     If you want to distinguish these things from the UML's defined building blocks, create a new building block by using stereotypes to specify these new semantics and to give   a distinctive visual cue.
·                     If the thing you are modeling is some kind of hardware that itself contains
            software, consider modeling it as a kind of node, as well, so that you can further     expand on its   structure.

Introduction to UML


Introduction to UML:

UML (Unified Modeling Language) is a language used for visualizing, specifying, constructing and documenting the artifacts of a software intensive system.”

    Building Blocks of UML:
                                
v  Things
v  Relationships
v  Diagrams
    
   Things in UML:
Ø  Structural things
·         Classes
·         Interfaces
·         Collaborations
·         Use Cases
·         Active Classes
·         Components
·         Node

Ø  Behavioral things
·         Interactions
·         State machines

Ø  Grouping things
·         Packages

Ø  Annotational things
·         Notes
  Relationships in UML:

ü  Dependency
ü  Association
ü  Generalization
ü  Realization
 Diagrams in UML :
ü  Class Diagram
ü  Object Diagram
ü  Use case Diagram
ü  Sequence Diagram
ü  Collaboration Diagram
ü  State chart Diagram
ü  Activity Diagram
ü  Component Diagram
ü  Deployment Diagram
Use Case Diagrams:
           A use case diagram is a diagram that shows a set of use cases and actors and their relationships.
      A use case diagram commonly contain
·                     Use cases
·                     Actors
·                     Dependency
·                     Generalization and Association Relationships.

     Use case diagrams may also contain packages, which are used to group elements of your model into larger chants.

Use case diagram is used in one of two ways
1) To model the context of a system.
2) To model the requirements of a system.

Modeling Techniques:

                1. Identity the actors that surround the system by considering which groups require help from the system to perform their tasks, which groups are needed to execute the systems functions; which groups interact with external hardware or other software systems; and which groups perform secondary functions for administration & maintenance.

              2.Organize actors that are similar to one another in a generalization/specification hierarchy.
  3. Where it aids understandability, provide a stereotype for each such actor.
              4. Populate a use case diagram with these actors and specify the paths of communications from each actor to the system’s use cases.


TUESDAY, 5 NOVEMBER 2013

Library Management System

Class Diagram
 Use Case Diagram
 Activity Diagram
 Collaboration

 Deployment Diagram

Sequence Diagram

State Chart diagram
 

FRIDAY, 1 NOVEMBER 2013

To create a UML diagram of ATM APPLICATION

Class Diagram


UseCase Diagram
Sequence Diagram
Collaboration diagram
Activity Diagram
State Chart diagram
Component Diagram

Deployment Diagram

Tuesday, 22 October 2013

DW&DM Material

What is Data Mining?

Overview

Generally, data mining (sometimes called data or knowledge discovery) is the process of analyzing data from different perspectives and summarizing it into useful information - information that can be used to increase revenue, cuts costs, or both. Data mining software is one of a number of analytical tools for analyzing data. It allows users to analyze data from many different dimensions or angles, categorize it, and summarize the relationships identified. Technically, data mining is the process of finding correlations or patterns among dozens of fields in large relational databases.

What is the KDD Process?http://www2.cs.uregina.ca/~dbd/cs831/notes/kdd/1_kdd.html

The term Knowledge Discovery in Databases, or KDD for short, refers to the broad process of finding knowledge in data, and emphasizes the "high-level" application of particular data mining methods. It is of interest to researchers in machine learning, pattern recognition, databases, statistics, artificial intelligence, knowledge acquisition for expert systems, and data visualization.
The unifying goal of the KDD process is to extract knowledge from data in the context of large databases.
It does this by using data mining methods (algorithms) to extract (identify) what is deemed knowledge, according to the specifications of measures and thresholds, using a database along with any required ,

 Preprocessing [Sec. 2.3]
• Aggregation
• Sampling
– Sampling with(out)
replacement
– Stratified sampling
• Discretization
– Unsupervised
– Supervised
• Feature creation
• Feature transformation
• Feature reduction
Click-->What is DWM? Explain OLAP & OLAM

 Explain Data integration & Transformations( Explain Data integration & Transformations
Slides:|


  • 2. What is Data Integration? Data Integration is one of the steps of Data Preprocessing that involves combining data residing in different sources and providing users with a unified view of these data. Itdoes merging data from multiple data stores (data sources)
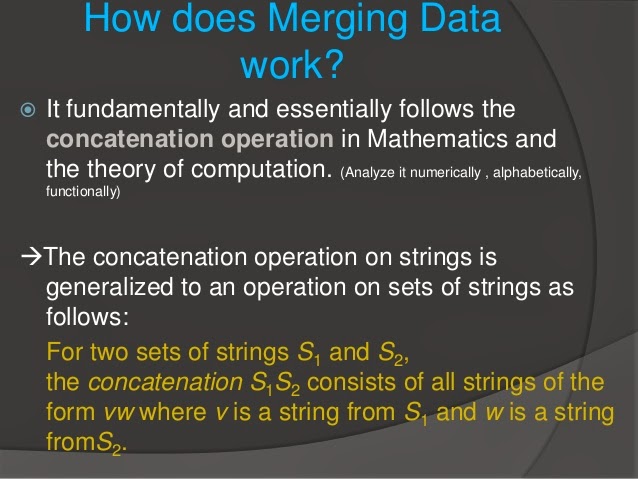
  • 3. How does Merging Data work? It fundamentally and essentially follows the concatenation operation in Mathematics and the theory of computation. (Analyze it numerically , alphabetically, functionally)The concatenation operation on strings is generalized to an operation on sets of strings as follows: For two sets of strings S1 and S2, the concatenation S1S2 consists of all strings of the form vw where v is a string from S1 and w is a string fromS2.
  • 4. REMEMBER … Merging data from data stores Concatenation in dataDecrease the redundancy in the resulting data set Increasing the accuracy and speed of mining process
  • 5. A problem that is referred to as the entity Identification problem: How can equivalent real-world entities from multiple data sources be matched up? (We have object matching and Schema integration. And should be reminded that metadata can be used to help avoid errors in Schema integration.) Certainly, this topic is more related with data cleaning. But I wanted to remind it before entering the Data Integration and analyzing the redundancy problem.
  • 6. Redundancy is an important issue An attribute may be redundant if it can be derived from another attribute or set of attributes. (Analyze it) Inconsistencies in attribute or dimension naming can also cause redundancies in the resulting data set. Some redundancies can be detected by correlation Analysis. (Analyze it) Given two attributes, such analysis can measure how strongly one attribute implies the other, based on the available data.
  • 7. Correlation coefficient (I) For numerical attributes, we can evaluate the correlation between two attributes, A and B, by computing the correlation coefficient. N N  (a i  A )( bi  B )  (a b )  N i i AB i 1 i 1 rA , B   N A B N  A BWhere N is the number of tuples, a and b with index i are the respective values of A and B. Small Sigmas with index A and B are the respective standard deviations of A and B. Standard deviation is a widely used measure of variability or diversity used in statistics and probability theory. It shows how much variation or "dispersion" exists from the average (mean or expected value)
  • 8. Different situations of the correlation between A and B The maximum amount of r is +1 and the minimum is -1. If r is greater than 0, then A and B are positively correlated.  Hence, a higher value may indicate that A or B may be removed as a redundancy. If the resulting value is 0, then A and B are independent and there is no correlation between them. If the resulting value is less than 0, then A and B are negatively correlated.
  • 9. Distribution In mathematical analysis, distributions (or generalized functions) areobjects that generalize functions. In probability theory, a probability mass, probability density,or probability distribution is a function that describes the probability ofa random variable taking certain values. We need to distinguish between discrete and continuous randomvariables.
  • 10. A sample of distribution table
  • 11. Chi – Square Distribution It’s not symmetric. Ranges from 0 to infinity - no negative values. Slopes to the right. Total area under the curve = 1 It has family; Different chi-square distribution for each value of the degrees of freedom.
  • 12. Correlation coefficient (II) For discrete data, a correlation relationship between two attributes, A and B, can be discovered by a chi-square test. Suppose A has c distinct values, and B has r distinct values. Our data tuples described by A and B shown as a contingency table. The c values of A are the columns and r values of B are the rows. Chi-square ( or Pearson chi-square statistic) is computed as: ( o ij  e ij ) c r 2    2 i 1 j 1 e ij Where o is the observed frequency and e is the expected frequency, which can be computed as: count ( A  a i )  count ( B  b j ) eij  N Where N is the number of data tuples, Count is the number of tuples having value a for A and b for B. The sum in the previous equation is computed over all r . c cells. Note that the cells that contribute the most to the chi-square value are those whose actual count is very different from that expected.
  • 13. We are studying on a group of 1500 people. Gender is noted.Each person was polled as to whether their preferred classical music or pop. This table is the result of our research: ATT 1 / ATT 2 MALE FEMALE TOTAL CLASSICAL M 250 / 90 200/360 450 POP M 50/210 1000/840 1050 TOTAL 300 1200 1500We have two attributes, gender and preferred-music. The observed frequency (orcount) of each possible joint event is summarized in our table. Using the second equation, we can calculate the expected frequencies for eachcell. For example the expected frequency for the first cell is 90 ; (300 * 450) / 1500 Using the first equation, we get 507.93. We followed this equation: (250  90) (50  210) (200  360) (1000  840) 2 2 2 2      2 90 210 360 840
  • 14. What is Data Transformation & what does it do? In Data Mining pre-processes and specially in metadata and data warehouse, we use data transformation in order to convert data from a source data format into destination data. We can divide data transformation into two steps:1. Data Mapping that maps data elements* from the source to the destination and captures any transformation that must occur.2. Code Generation that creates the actual transformation program Data element to data element mapping is frequently complicated by complex transformations that require one-to-many and many-to-one transformation rules.
  • 15. In data transformation, the data are transformed or consolidated into form appropriate for mining.Data transformation can involve: Smoothing, that removes noise. Such techniques include binning, regression, and clustering. (We know it is a form of data cleaning) Aggregation, where summary or aggregation operations are applied to the data. It typically constructs a data cube for multiple analysis of the data. (Refers to data reduction) Generalization of the data, where low-level data are replaced with higher-level concepts. It can be used for categorical(?) and numerical(?) attributes. (Refers to data reduction) Normalization, where the attribute data are scaled so as to fall within a small specified range. (So helpful for classification algorithms) Attribute construction, where new attributes are constructed and added from the given set of attributes to help the mining process.
  • 16. Data Normalization Or standardization: The imposition of standards or regulations Statistical view In one usage in statistics, normalization is the process of isolating statistical error in repeated measured data. A normalization is sometimes based on a property. Most of the computed descriptors differ in the scales in which their values lie. One may need to normalize them before proceeding with further statistical analysis.
  • 17. Min-max NormalizationThis normalization performs a linear transformation on the original data.Suppose that A is an attribute. This normalization maps a value (v) of A to(v*) in the range [new_min(A), new_max(A)] by computing: v  m in( A )v  ( new _ m ax( A )  new _ m in( A ))  new _ m in( A ). * m ax( A )  m in( A )Actually, this normalization preserves the relationship among the originaldata values.Note that if an input case for normalization falls outside of the originaldata range for A, it will encounter an “out_of_bounds” error. And will giveerror.
  • 18.  Suppose that the minimum and maximumvalues for the attribute income are $10,000 and$100,000.We would like to map income to the range [0.0 , 1.0]. A value of $70,000 for income is transformedto[(70,000-10,000) / (100,000-10,000)](1-0)+0 = 0,666 .
  • 19. Z-score normalization (or zero-mean normalization) Here, the values of an attribute, are normalized based on mean and standard deviation of A. Value of A (v) is normalized to(v*) by computing: v A v  *  A Where A with bar symbol is the mean and Sigma is the standard deviation of attribute A.  We note that this method of normalization is very useful when the minimum and maximum of the attribute are unknown. Or when there are outliers that dominate the min-max normalization.
  • 20.  Suppose that the mean and standard deviation of the values for the attribute income are $50,000 and $15,000 . With z-score normalization, a value of $70,000 for income is transformed to [(70000-50000)(15000)] = 1.333 .
  • 21. Normalization by decimal scaling  Normalizes by moving the decimal point of values of attribute A.  The number of decimal points moved depends on the maximum absolute value of A.  A value, v, is normalized to v* by computing v* = v / 10^j , where j is the smallest integer such that Max( ABS(v*)) < 1
  • 22. Suppose that the recorded values of A range from -825 to 637.The maximum absolute value of A is 825  So that -825 normalizes to -0.825 and 637 normalizes to 0.637
  • 23. Note that …Normalization data can change the original data quite a bit. In attribute construction, new attributes are constructed from the given attributes and added in order to help improve the accuracy and understanding of structure in high-dimensional data. For example, we can add the attribute area based on the attributes height and width. By combining attributes, attribute construction can discover missing information about the relationships between data attributes that can be useful for knowledge discovery.